
Market Research
How We Built a Data-Backed Microcap Premarket Watchlist
Which Day−1 Parameter States Predict the Most Day1 Volatility?
Summarize this research with AI
Open the article in your preferred assistant with a ready-to-use summary prompt.
The prompt is also copied to your clipboard as a fallback if the provider does not prefill it automatically.
Key findings
- Microcap Engine reconstructed 239 signal sessions and 171,701 historical ticker-days, then evaluated 11,771 supported Day−1 parameter combinations against next-session 04:00–20:00 ET range.
- Day−1 full range showed the strongest single gradient: HOLDOUT median Day1 range rose from 13.11% at a 10% threshold to 51.84% at 150%.
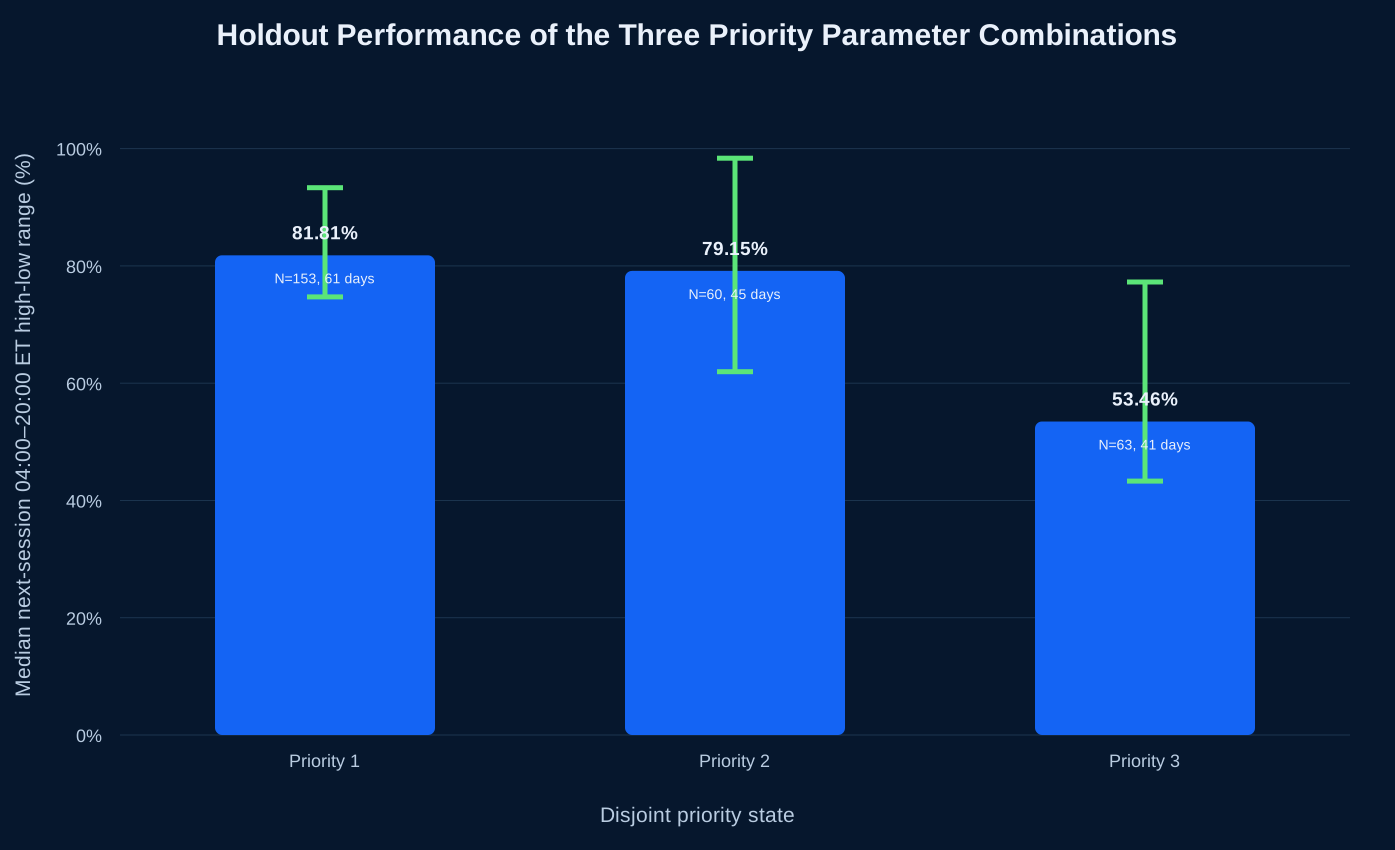
- The strongest disjoint priority combinations produced 81.81%, 79.15% and 53.46% median Day1 ranges in the HOLDOUT.
- The broader daily ranking is deterministic and fully disclosed: 33% range, 20% dollar volume, 15% median RVOL, 10% AH relative activity, 10% range-edge context, 5% AH dollar volume, 5% AH range ratio and 2% AH dollar share.
- Across the chronological research segments, the hierarchy consistently identified Day−1 states associated with elevated Day1 volatility; the strongest evidence is for stable parameter regions rather than one uniquely optimal cutoff.
- The final publication order adds a separate Grok AI X Attention layer covering discussion from the prior 16:00 ET RTH close to research time, followed by a personal morning QA pass with manual float verification and dilution-risk review.
Core idea. Microcap Engine’s PM Preparation watchlist is not based on intuition or a hand-picked list of “hot” indicators. We reconstructed 239 historical signal sessions, tested thousands of Day−1 parameter states and combinations, and asked one empirical question: which information available before the next session most consistently preceded the largest Day1 04:00–20:00 ET high-low range? Current X attention is applied later as a separate real-time ordering layer; it is not used to discover or validate the historical Day−1 rules.
A premarket watchlist has one practical job: decide which stocks deserve a trader’s attention before the next session begins.
For microcaps, that decision is easy to make subjectively.
A trader can look at yesterday’s biggest gainers, the highest RVOL names, the smallest floats or the most active after-hours stocks.
We wanted the historical selection logic to meet a different standard.
We wanted the Microcap Engine watchlist to be historically testable.
That meant defining the future outcome first, freezing the information set to Day−1, reconstructing a historical sub-$500M universe, testing explicit parameter values and combinations, and then asking whether those states actually preceded larger next-session volatility.
The research target was deliberately direction-neutral:
Which Day−1 parameter combinations and threshold values are associated with the highest median Day1 full-session high-low percentage range?
Day−1 is the completed signal session.
Day1 is the following 04:00–20:00 ET trading session.
The analysis therefore does not attempt to predict whether a stock will go up or down. It attempts to identify stocks that are empirically more likely to remain in play.
The final RAW V2 study covered:
- 239 historical signal sessions
- 171,701 historical ticker-days
- 170,539 analyzed ticker-days after identity and signal-day data-quality exclusions
- 11,771 supported numeric combinations in the main parameter search
- a chronological 100 / 67 / 72 session FIT / VALID / HOLDOUT split
The result was not one magic indicator.
It was a hierarchy of Day−1 market states.
Prior-day price expansion showed the strongest single gradient. Relative volume added information. After-hours dollar activity mattered in both absolute and relative terms. Historical market cap materially changed the base rate of future volatility. Close position became useful conditionally. And the strongest watchlist candidates were produced by combinations of these variables rather than by any one metric in isolation.
What Exactly Did We Optimize?
The primary outcome was:
Day1 Range % = (Day1 High − Day1 Low) / Day1 Low × 100
measured over the full 04:00–20:00 ET session immediately after the completed Day−1 signal session.
This choice matters.
We did not optimize for:
- long returns,
- short returns,
- close-to-close returns,
- maximum favorable excursion from a chosen entry,
- realized trading P&L,
- fill quality,
- or a directional label.
A stock that trades from $2 to $4 and then closes at $2.50 has created an enormous intraday opportunity set even if a close-to-close directional label describes the day poorly.
The PM Preparation problem is therefore:
Which completed Day−1 states make a large Day1 range more likely?
not:
Which stocks should be bought tomorrow?
This keeps the watchlist useful to both long and short traders and prevents the research from being biased toward one directional strategy.
The Historical Dataset
The final analysis covered 239 historical signal sessions from October 27, 2025 through October 8, 2026.
The raw historical source contained 171,701 ticker-days. After signal-day bar and issuer-identity controls, 170,539 ticker-days remained in the analytical set.
| Item | Result |
|---|---|
| Historical signal sessions | 239 |
| Raw historical ticker-days | 171,701 |
| Analyzed ticker-days after signal-day QA | 170,539 |
| Missing Day1 outcomes | 825 (0.48%) |
| Ambiguous/recycled-issuer ticker-days excluded | 1,161 |
| Signal days without usable 30-minute bars excluded | 1 |
| Rows with split-normalized prior-volume history | 2,797 |
| Supported numeric combinations in the main search | 11,771 |
The research universe was limited to the Microcap Engine sub-$500M U.S. stock scope.
Historical market capitalization was taken from the signal date rather than applying today’s market cap backward through history.
That prevents a basic form of look-ahead contamination.
A company that is worth $40M today may have been worth $200M on a historical signal date. Treating it as a $40M stock throughout history would change both the candidate universe and the interpretation of its volatility.
Historical market cap came from FMP’s dated historical market-cap series. That vendor date is useful for historical classification, but it is not independently certified as an SEC-publication-time known-at value. We therefore treat it as dated historical vendor data rather than claiming perfect filing-time fundamentals.
Signal features were built from raw/unadjusted 30-minute historical bars. Previous-session share-volume baselines were normalized as-of for effective splits so a later split could not manufacture a historical RVOL spike.
The Split Was Chronological
The 239 sessions were divided into:
- FIT: 100 sessions
- VALID: 67 sessions
- HOLDOUT: 72 sessions
The main parameter search and tier selection were driven by FIT and VALID.
The final 72 sessions were kept as a later chronological HOLDOUT segment and reported separately. Because the research evolved iteratively, we treat that segment as retrospective historical validation rather than make a stronger prospective claim.
The practical takeaway is unchanged: the data supports broad regions of useful parameter space much more strongly than it supports the idea that one exact boundary is universally optimal.
We Did Not Start With the Final Rules
The final watchlist logic was not chosen first and justified afterward.
The search began with a broad parameter grid.
The candidate feature families included:
| Feature family | Thresholds / states tested |
|---|---|
| Median20 RVOL | 2×, 3×, 4×, 5×, 7×, 10×, 15×, 20× plus non-overlapping bins |
| Full-session Range | 10%, 20%, 30%, 40%, 60%, 75%, 100%, 125%, 150% plus non-overlapping bins |
| Full Dollar Volume | $1M, $3M, $5M, $10M, $20M, $30M, $50M, $100M plus bins |
| AH relative dollar activity | 1×, 2×, 3×, 5×, 10×, 20× plus bins |
| AH range ratio | 0.25×, 0.5×, 1×, 1.5×, 2×, 3× |
| Full Close Position | 20%, 40%, 60%, 80% and interval variants |
| Distance from range edge | 10%, 20%, 30%, 40% |
| AH Dollar Volume | $100k, $300k, $1M, $3M, $10M, $30M plus bins |
| AH Dollar Share | 5%, 10%, 20%, 30%, 50%, 70% plus bins |
| Historical Market Cap | <$5M, $5–10M, $10–25M, $25–50M, $50–100M, $100–250M, $250–500M |
| New-activity states | positive signal-day activity after a zero historical baseline |
Single conditions were evaluated first.
Then all distinct-feature two-way interactions were evaluated.
The stronger two-way candidates were expanded into deeper three- and four-feature interactions, while an explicit four-way family grid also tested combinations of RVOL, range, after-hours activity and historical market-cap interval.
The main final search retained 11,771 supported combinations.
A Rule Had to Have Real Support Before We Took It Seriously
A high median from five historical examples is not a usable rule.
For the main search, a candidate rule needed, in both FIT and VALID:
- at least 100 observed ticker-days
- at least 30 distinct trading dates
- at least 15 distinct issuers
- at least 95% observed outcome coverage
Rules that failed those gates did not qualify as supported combinations.
This is one of the most important parts of the research.
Without minimum-support constraints, a threshold optimizer will naturally discover tiny pockets of history with extraordinary outcomes.
Those pockets often disappear immediately when exposed to new data.
Our goal was not to find the largest historical number.
It was to find a sufficiently broad state that remained strong across different chronological samples.
How We Ranked Candidate Rules
For every supported rule, we measured its median Day1 range separately in FIT and VALID.
We then applied a small shrinkage toward each split’s unconditional median using the number of qualifying trading days:
Shrunk Median = (Rule Days × Rule Median + 20 × Split Baseline Median) / (Rule Days + 20)
That prevents a rule observed on relatively few days from being treated as equally certain as a rule observed across much more history.
The candidate-rule objective was then:
Objective = min(Shrunk FIT Median, Shrunk VALID Median) − 0.25 × |Shrunk FIT Median − Shrunk VALID Median|
That objective deliberately rewards three things:
- high volatility,
- strength in both FIT and VALID,
- and smaller disagreement between the two periods.
A rule that looked spectacular in FIT and mediocre in VALID was penalized.
This was designed to favor stable parameter states rather than the best historical accident.
The Final Objective Was the Daily Basket, Not a Pooled Ticker-Day Statistic
A PM Preparation product does not need one interesting historical rule.
It needs a useful list every day.
So the final tier selection was scored on the daily 10-name basket.
For each session:
- candidates were ordered deterministically,
- higher-priority rules were applied first,
- the same ticker could appear only once,
- unfilled slots were completed by the broader Day−1 ranking,
- and the median Day1 range of the ten selected names became the daily outcome.
The primary basket score was the median of those daily basket medians.
This is materially different from pooling thousands of selected ticker-days together.
Pooling can allow a handful of unusually rich dates to dominate the result.
The daily-basket objective asks the more practical question:
Did the model consistently put volatile names near the top on an ordinary trading day?
Missing Day1 Outcomes Were Handled Conservatively
Missing future outcomes were never silently recorded as observed 0% moves.
For each 10-name basket we calculated a mathematical lower bound by replacing missing nonnegative Day1 ranges with zero only for the lower-bound calculation.
The actual missing observation remained missing.
A model also had to maintain at least 90% fully observed 10-name baskets within a split to be scoreable.
This protects the optimization from looking better simply because difficult or unavailable future observations disappear from the evaluation.
How a Candidate Became a Priority Tier
After candidate-rule discovery, the strongest rule was not automatically accepted.
Priority tiers were added incrementally.
At each step a new rule had to contribute a disjoint population not already captured by higher tiers.
That incremental population needed, in both FIT and VALID:
- at least 50 observations
- at least 15 trading dates
- at least 10 issuers
VALID also required at least 95% observed outcomes.
Then the proposed tier was inserted into the full daily Top10 simulation.
To be accepted, it had to:
- improve the VALID daily-basket median by at least 0.50 percentage points
- and avoid degrading the FIT daily-basket median by more than 0.50 percentage points
This is why the final model is better described as an empirically selected hierarchy than as a list of attractive-looking thresholds.
The Broader Day−1 Ranking Is Also Explicit
Rare high-volatility states cannot fill ten slots every day.
For candidates not already captured by a higher-priority rule, the broader ranking used within-day percentile ranks.
The exact score was:
33% Prior-day Full Range percentile
+ 20% Full Dollar Volume percentile
+ 15% Median20 RVOL percentile
+ 10% AH Relative Dollar Activity percentile
+ 10% Distance-from-Range-Edge percentile
+ 5% AH Dollar Volume percentile
+ 5% AH Range Ratio percentile
+ 2% AH Dollar Share percentile
Total = 100%
Within a trading day, higher score ranks first.
Ties are deterministic.
The ticker symbol is the final stable tie-break.
This matters because “fallback” should not mean arbitrary.
Even the broad pool is ranked using Day−1 variables whose relationships were measured historically.
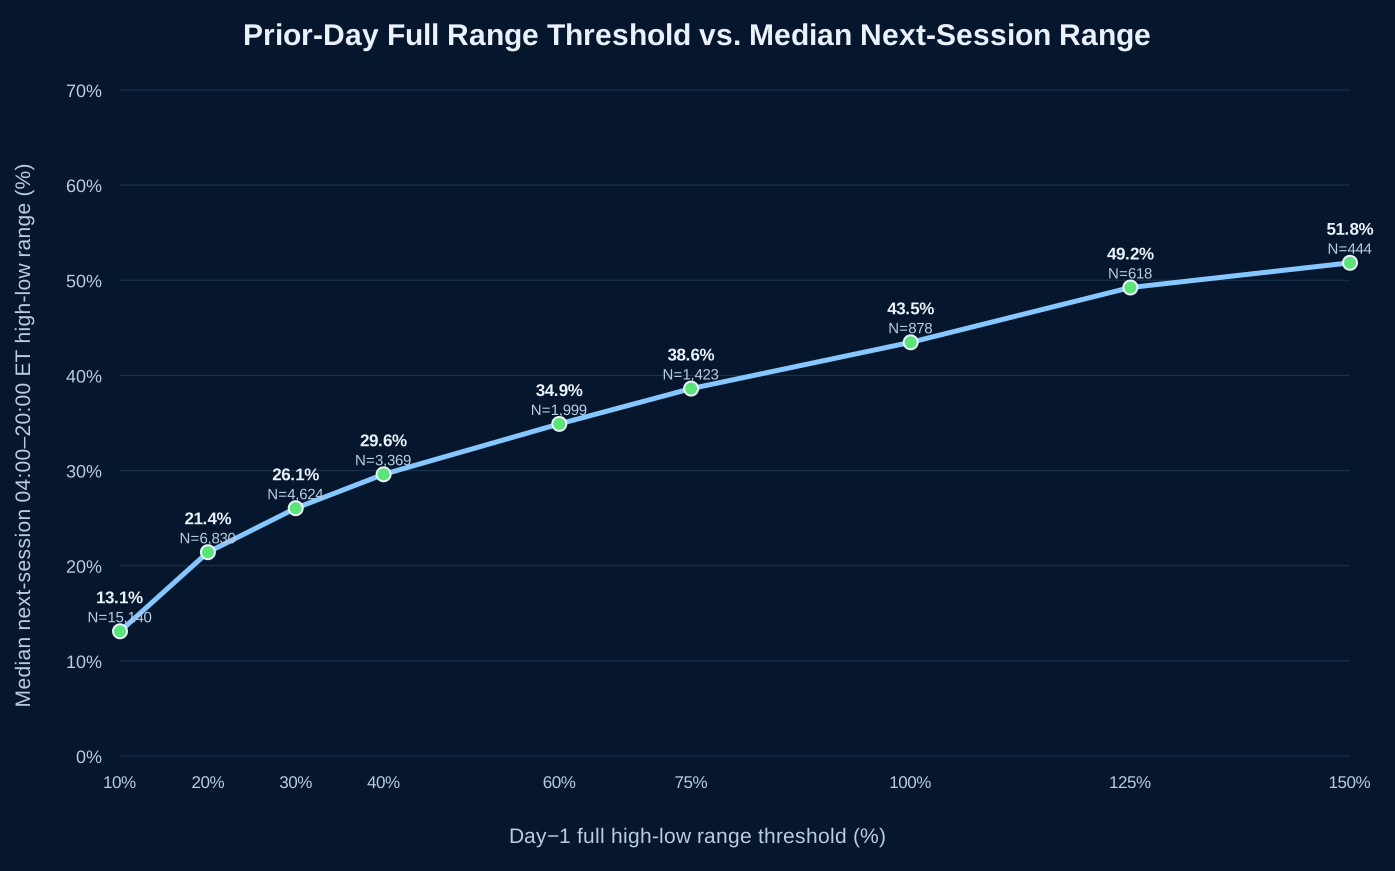
The First Major Empirical Result: Prior-Day Range
The clearest single-variable relationship came from the completed Day−1 full-session range.
| Day−1 Range ≥ | Observed N | Days with ≥10 candidates | Median Day1 range | MC/day lift |
|---|---|---|---|---|
| 10% | 15,140 | 72 | 13.11% | 1.44× |
| 20% | 6,830 | 72 | 21.42% | 1.60× |
| 30% | 4,624 | 72 | 26.05% | 1.66× |
| 40% | 3,369 | 72 | 29.61% | 1.74× |
| 60% | 1,999 | 72 | 34.91% | 1.87× |
| 75% | 1,423 | 69 | 38.62% | 2.08× |
| 100% | 878 | 50 | 43.48% | 2.39× |
| 125% | 618 | 27 | 49.24% | 2.61× |
| 150% | 444 | 13 | 51.84% | 2.84× |
As the completed Day−1 range threshold rose from 10% to 150%, the HOLDOUT median Day1 range increased from 13.11% to 51.84%.
The relationship was also monotonic in non-overlapping intervals:
| Day−1 Range interval | Median Day1 range |
|---|---|
| 10–20% | 9.65% |
| 20–40% | 16.14% |
| 40–60% | 23.97% |
| 60–100% | 28.74% |
| 100–150% | 37.02% |
| ≥150% | 51.84% |
This was the strongest single observed gradient in the study.
But coverage falls as selectivity rises.
That is why range became both an important ranking input and a component of higher-conviction rules rather than the only filter.
Median20 RVOL Added Confirmation
RVOL was defined as:
Day−1 04:00–20:00 ET volume / median volume of the preceding 20 completed sessions
The prior-volume history was normalized as-of for splits.
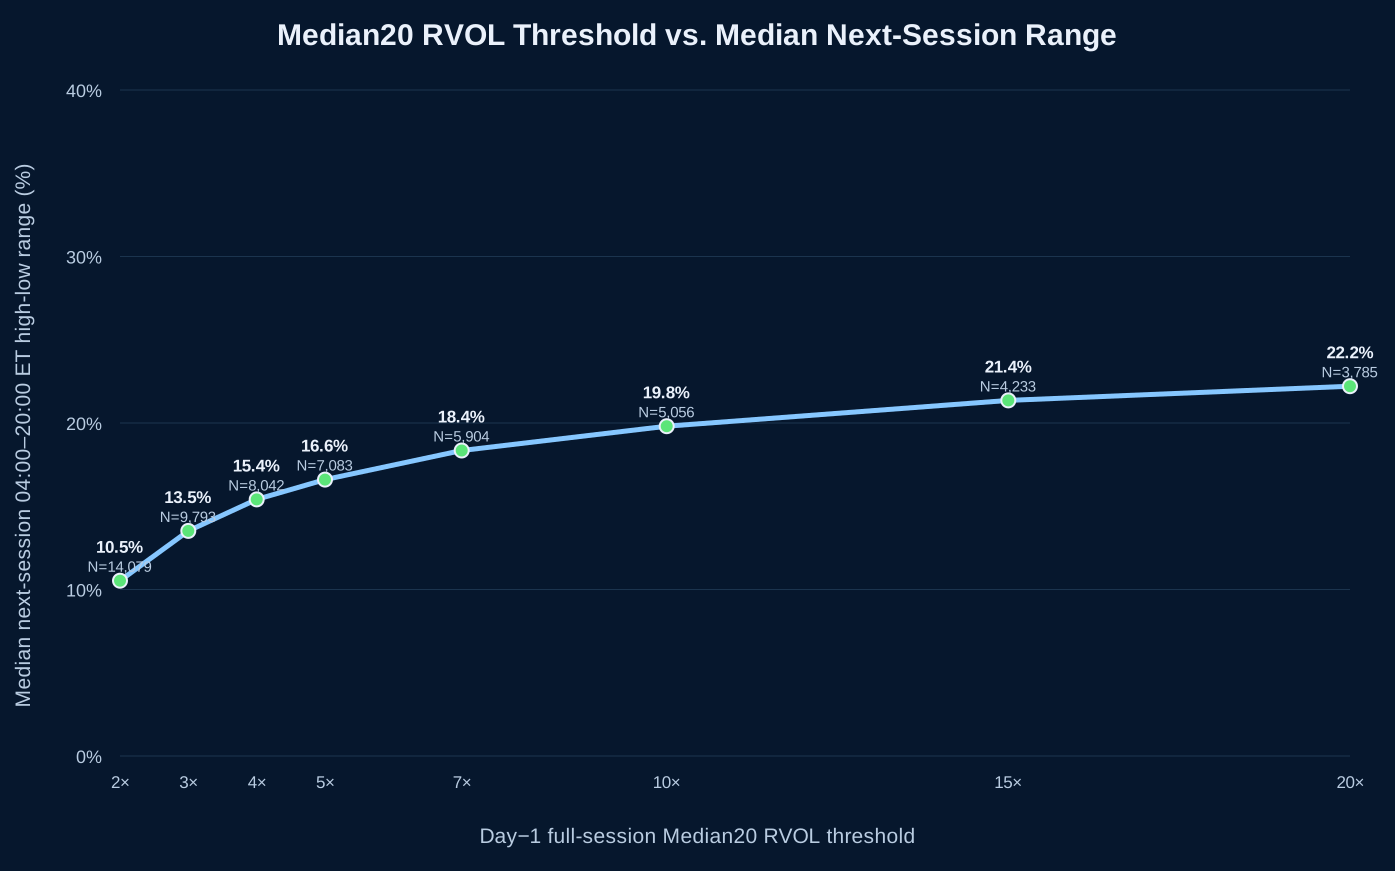
| RVOL ≥ | Observed N | Median Day1 range | MC/day lift |
|---|---|---|---|
| 2× | 14,079 | 10.53% | 1.13× |
| 3× | 9,793 | 13.52% | 1.18× |
| 4× | 8,042 | 15.41% | 1.20× |
| 5× | 7,083 | 16.60% | 1.21× |
| 7× | 5,904 | 18.35% | 1.22× |
| 10× | 5,056 | 19.81% | 1.23× |
| 15× | 4,233 | 21.36% | 1.25× |
| 20× | 3,785 | 22.21% | 1.28× |
Higher RVOL consistently corresponded to higher subsequent volatility.
But the gradient was weaker than the Day−1 range gradient.
That is why RVOL works better here as evidence of abnormal participation inside a broader state than as the entire watchlist model.
After-Hours Participation Was Strongly Informative
A stock can be highly active during the day and lose attention immediately afterward.
Another can continue to trade meaningful capital after the regular close.
Those states were empirically different.
AH Dollar Share
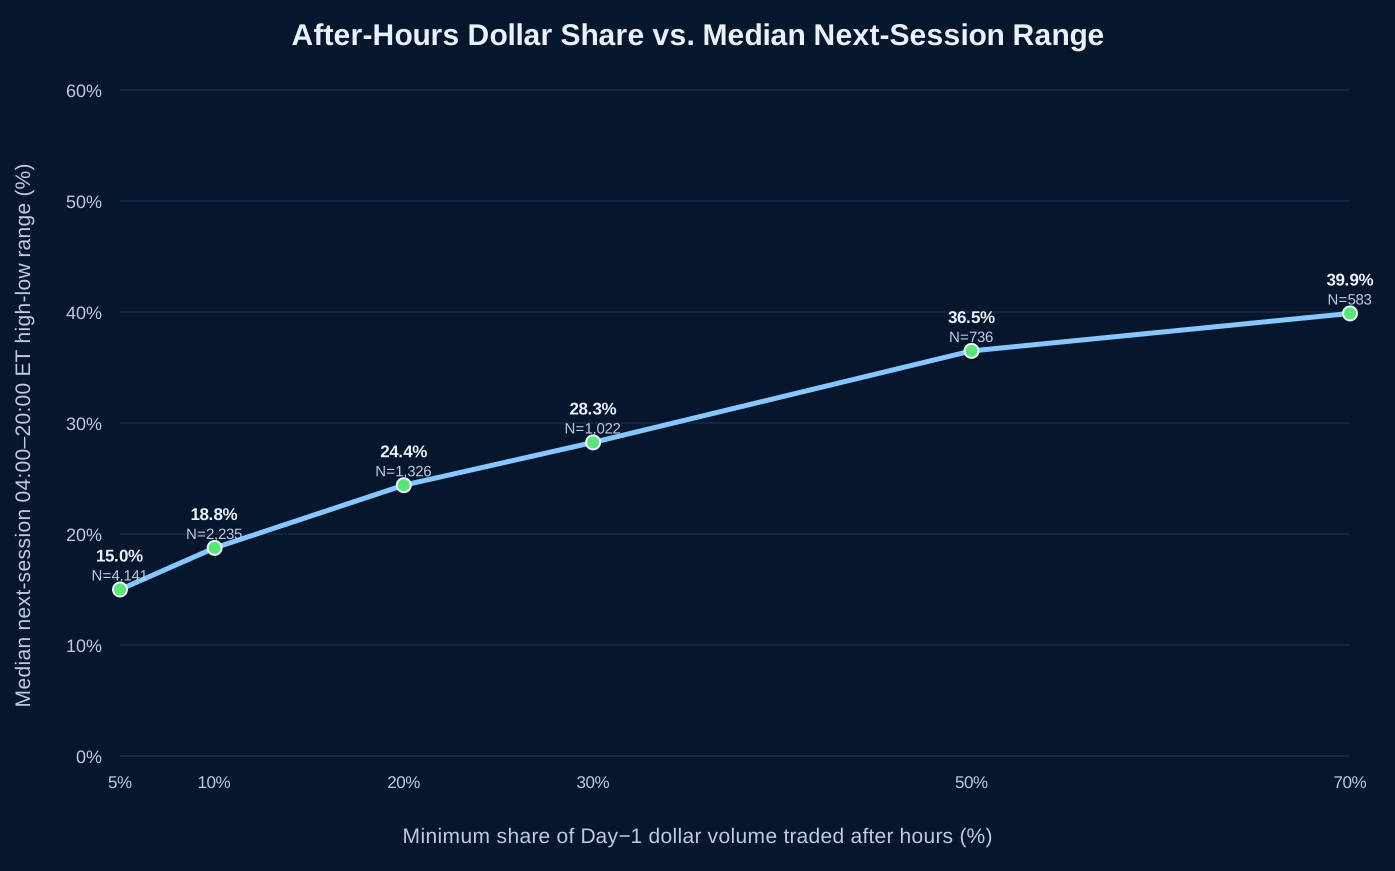
| AH Dollar Share ≥ | Observed N | Median Day1 range |
|---|---|---|
| 5% | 4,141 | 15.00% |
| 10% | 2,235 | 18.75% |
| 20% | 1,326 | 24.40% |
| 30% | 1,022 | 28.25% |
| 50% | 736 | 36.50% |
| 70% | 583 | 39.87% |
Absolute AH Dollar Volume
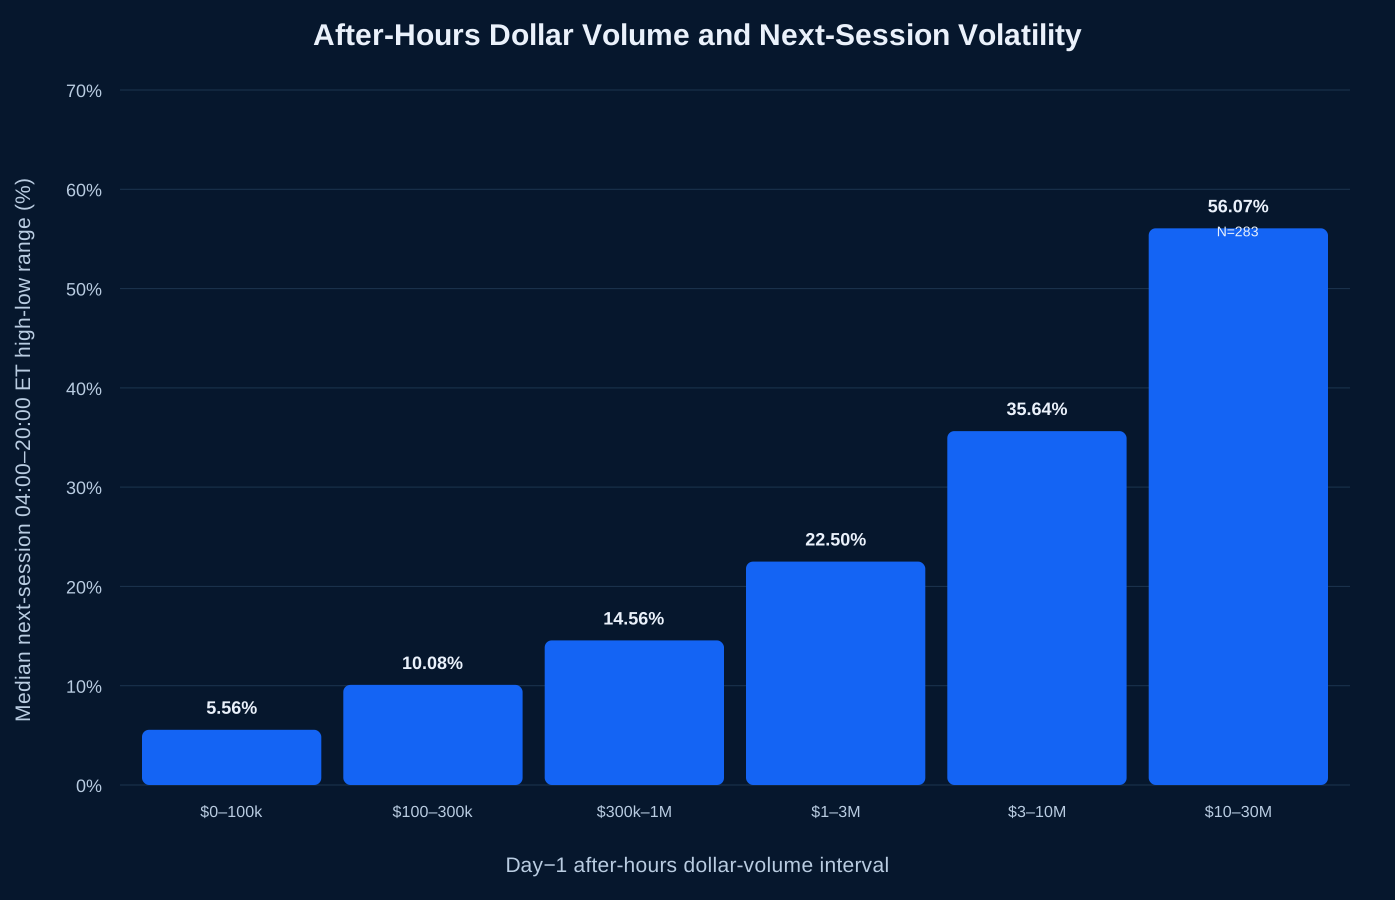
| AH Dollar Volume interval | Median Day1 range |
|---|---|
| $0–100k | 5.56% |
| $100–300k | 10.08% |
| $300k–1M | 14.56% |
| $1–3M | 22.50% |
| $3–10M | 35.64% |
| $10–30M | 56.07% |
The $10M–$30M interval contained 283 observations.
The important point is not that every stock with large AH volume will move the next day.
The important point is that after-hours participation showed a clear historical gradient and therefore deserved explicit weight in the watchlist logic.
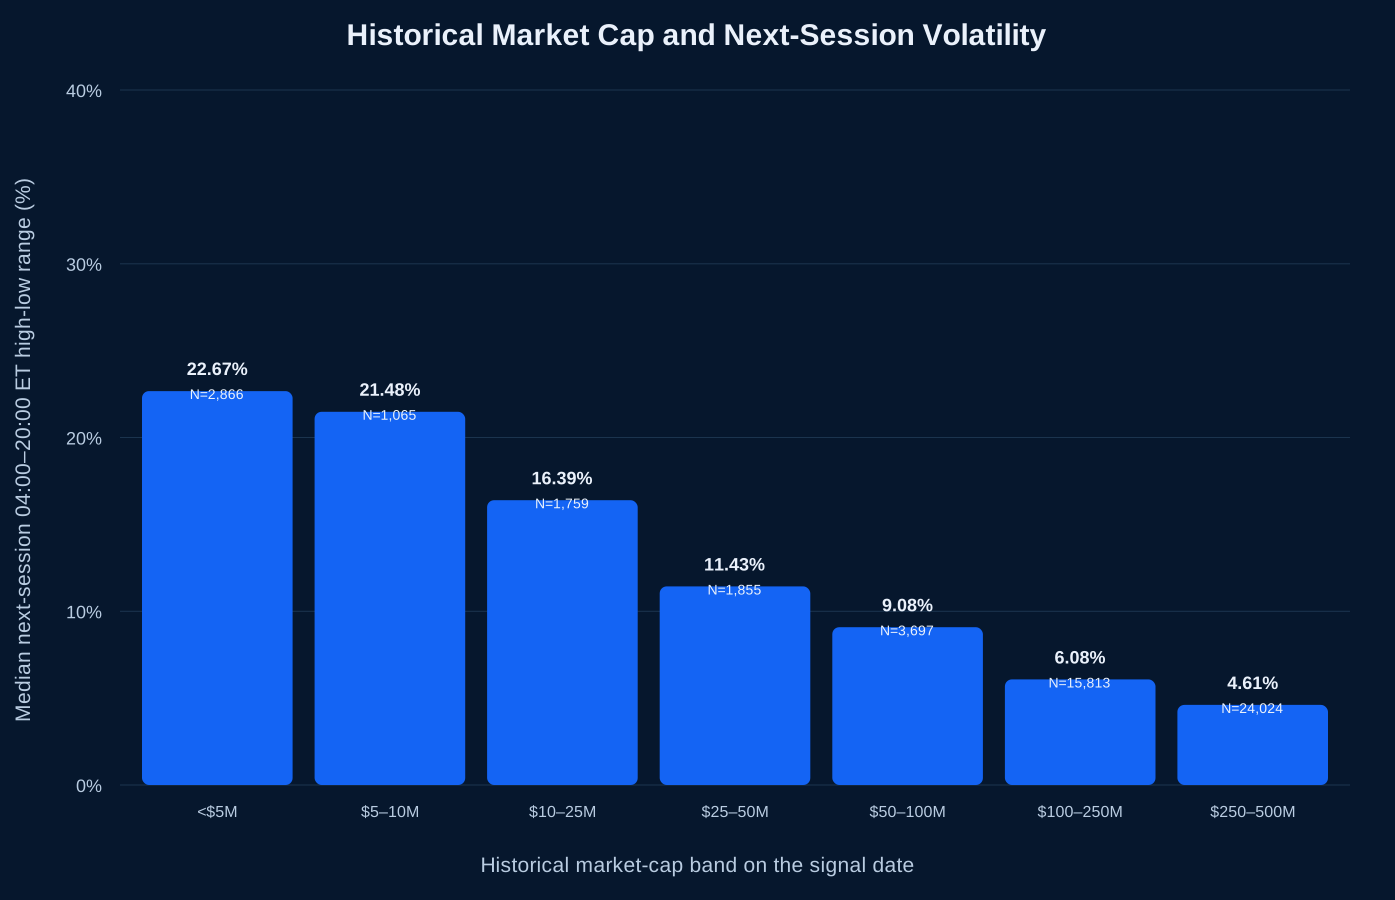
Historical Market Cap Changed the Base Rate
| Historical MC band | Observed N | Median Day1 range |
|---|---|---|
| <$5M | 2,866 | 22.67% |
| $5–10M | 1,065 | 21.48% |
| $10–25M | 1,759 | 16.39% |
| $25–50M | 1,855 | 11.43% |
| $50–100M | 3,697 | 9.08% |
| $100–250M | 15,813 | 6.08% |
| $250–500M | 24,024 | 4.61% |
The <$5M historical market-cap bucket produced a 22.67% median Day1 range.
The $250M–$500M bucket produced 4.61%.
That is almost a five-fold difference.
Market cap therefore matters as structural context.
But it is not sufficient by itself.
Many tiny stocks are inactive.
The highest-quality watchlist states emerged when size context was combined with actual Day−1 price expansion and participation.
Close Position Was Conditional, Not Dominant
Full Close Position measures where the completed Day−1 close sits inside that session’s full high-low range.
We did not find enough evidence to make it the main standalone signal.
It became useful inside combinations.
For example:
- Priority 2 uses Close Position ≥20%
- Priority 3 uses Close Position ≥70%
This is a useful distinction.
A variable does not have to be powerful by itself to improve a conditional state.
Some features answer:
“How much activity occurred?”
Others answer:
“What kind of activity state was it?”
Close Position belongs more to the second category in this research.
The Final High-Volatility Priority Logic
The research converged on three empirically stronger priority states.
The rules are disclosed here in full.
| Priority | Exact Day−1 rule | HOLDOUT observed N | HOLDOUT dates | Median Day1 range |
|---|---|---|---|---|
| Priority 1 | AH Dollar Share ≥5% AND Full Dollar Volume ≥$5M AND Full Range ≥150% AND Median20 RVOL ≥3× | 153 | 61 | 81.81% |
| Priority 2 | AH Dollar Share ≥30% AND Close Position ≥20% AND Full Range ≥100% AND Median20 RVOL ≥20×; exclude Priority 1 | 60 | 45 | 79.15% |
| Priority 3 | AH Dollar Volume ≥$1M AND Close Position ≥70% AND Full Range ≥60% AND <100%; exclude Priority 1 and 2 | 63 | 41 | 53.46% |
Priority 1
**Full Range ≥150%
- Median20 RVOL ≥3×
- Full Dollar Volume ≥$5M
- AH Dollar Share ≥5%**
HOLDOUT:
- 154 qualifying ticker-days
- 153 observed outcomes
- 61 dates
- 108 issuers
- median Day1 range 81.81%
- MC/day median lift 4.15×
- date-cluster bootstrap interval 74.72%–93.33%
FIT median: 86.57%
VALID median: 89.94%
This was the strongest broad state found in the final study.
Priority 2
**Full Range ≥100%
- Median20 RVOL ≥20×
- AH Dollar Share ≥30%
- Close Position ≥20%**
after excluding Priority 1.
HOLDOUT:
- 60 observed outcomes
- 45 dates
- 56 issuers
- median Day1 range 79.15%
- MC/day median lift 4.56×
- date-cluster bootstrap interval 61.95%–98.37%
FIT disjoint median: 79.03%
VALID disjoint median: 75.47%
The sample is smaller, so this should be interpreted as a complementary high-volatility state, not a claim that the exact four boundaries are a universal optimum.
Priority 3
A separate complementary search explicitly looked for a lower-overlap state missed by Priority 1 and Priority 2.
The selected rule was:
**AH Dollar Volume ≥$1M
- Close Position ≥70%
- Full Range ≥60% and <100%**
after excluding Priority 1 and Priority 2.
HOLDOUT:
- 63 observed ticker-days
- 41 dates
- 57 issuers
- median Day1 range 53.46%
- date-cluster bootstrap interval 43.30%–77.26%
The robustness check varied:
- AH Dollar Volume: $0.5M / $1M / $2M
- Close Position: 60% / 70% / 80%
- Full Range lower bound: 50% / 60% / 75%
- Full Range upper bound: fixed below 100%
All 27 neighboring combinations improved both FIT and VALID.
Those tests are correlated, so they are not independent replications.
But they do show that Priority 3 was not supported by one isolated point in parameter space.
Priority 4 and Priority 5 Exist for Coverage
Not every day contains ten Priority 1–3 names.
Two additional layers were therefore defined:
Priority 4 — Reserve
AH Dollar Volume ≥$300k
after excluding higher priorities.
This is a coverage reserve, not a claim of predictive equivalence to Priority 1–3.
Priority 5 — Coverage Capacity
Full Range ≥20%
used only when the higher layers do not provide enough unique candidates.
This is a coverage pool, not an alpha claim.
Across all 239 historical sessions:
- Priority 1–4 produced at least ten unique qualifiers on 237/239 days
- November 28, 2025 produced 9
- December 24, 2025 produced 7
- adding Priority 5 produced at least ten candidates on 239/239 days
- the minimum eligible pool became 46
- Priority 5 changed zero selected names in the historical study
This is why the hierarchy separates predictive priority from coverage capacity.
First Matching Priority Wins
The priority system is disjoint operationally.
For each Day−1 ticker:
- test Priority 1,
- otherwise test Priority 2,
- otherwise test Priority 3,
- otherwise Priority 4 reserve,
- otherwise Priority 5 only if capacity is needed.
A ticker is selected at most once.
Within the same priority level, candidates are ordered by the broader Day−1 percentile score described above.
This prevents the same stock from occupying multiple conceptual buckets and keeps the daily ranking deterministic.
Did the Priority Logic Improve the Daily Basket?
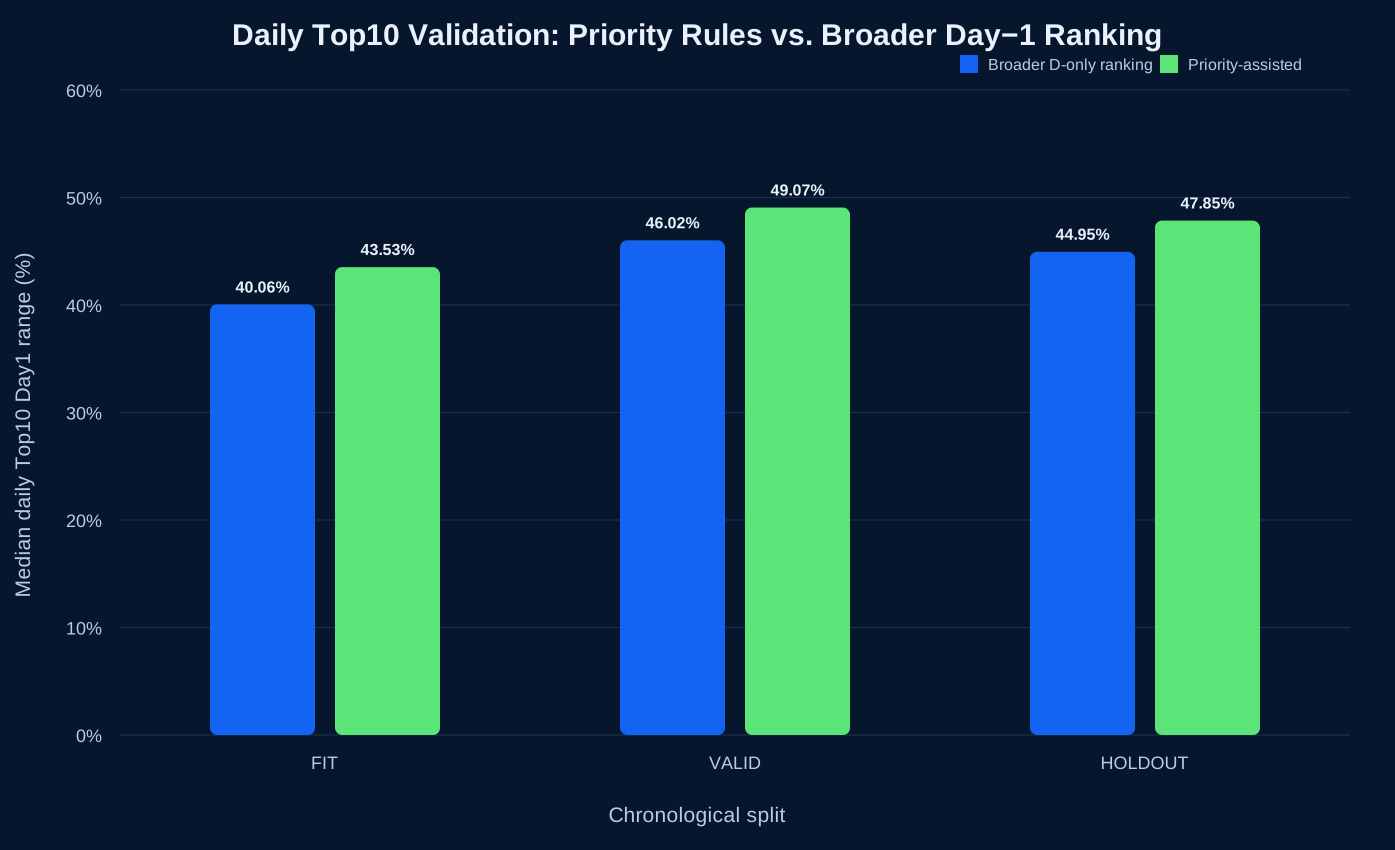
Yes, but the size of that improvement is much smaller than the headline medians of the rare high-volatility rules.
That is exactly what we should expect.
High-conviction states are rare.
Most daily slots still come from the broader ranking.
| Period | Days | Broader D-only ranking | Priority 1+2 assisted | Difference | 95% bootstrap interval |
|---|---|---|---|---|---|
| FIT | 100 | 40.06% | 43.53% | +3.47 pp | +0.82 to +6.77 pp |
| VALID | 67 | 46.02% | 49.07% | +3.04 pp | −0.20 to +9.26 pp |
| HOLDOUT | 72 | 44.95% | 47.85% | +2.89 pp | 0.00 to +7.03 pp |
In HOLDOUT:
- Priority 1 + Priority 2 filled 214 of 720 Top10 slots
- that is 29.7%
- the broader Day−1 ranking filled the remaining 70.3%
The priority-assisted median daily basket was 47.85%.
The broader ranking alone produced 44.95%.
Difference of period medians: +2.89 percentage points.
The paired daily median difference was 0.00 pp, and the lower end of the bootstrap interval was 0.00 pp.
Therefore the honest interpretation is:
The historical evidence strongly supports the existence of high-volatility Day−1 states. Placing the strongest states ahead of the broader ranking improved the period-level daily-basket medians across FIT, VALID and HOLDOUT, while the day-by-day uplift was naturally more modest because most daily slots still come from the broader ranking.
That is exactly why Microcap Engine separates empirical research from exaggerated marketing claims.
Why the Headline Rule Medians and Daily Watchlist Median Are Different
Priority 1 can show an 81.81% median Day1 range while the complete daily watchlist shows a median closer to the high-40% range.
There is no contradiction.
Priority 1 is rare.
A daily watchlist needs coverage.
The top of the hierarchy is optimized for unusually strong states.
The lower part is optimized to rank the broader candidate pool when those states do not provide enough names.
This distinction is crucial when evaluating any scanner.
A platform can publish a spectacular statistic for a rare filter.
That does not mean it can produce a useful list every morning.
We care about both:
- strength of the individual state
- and quality of the complete daily basket
Exact Thresholds Are Not Magic Numbers
The selected values should not be treated as laws of nature.
Nearby-threshold sensitivity showed plateaus.
For example:
- changing Priority 1 Full Range from ≥150% to ≥125% produced a VALID basket median of 50.39% versus 49.07% for the selected version in one neighboring test
- changing the Priority 2 range threshold from ≥100% to ≥75% produced 51.74%
Those observations do not mean we should retrospectively replace the thresholds with the best-looking neighboring value.
Doing that after seeing the outcome would be another round of overfitting.
The correct interpretation is:
the broader parameter region is more important than the exact decimal boundary.
Very large Day−1 range, abnormal participation, meaningful dollar turnover and persistent after-hours activity are the robust concepts.
The precise operational thresholds are one frozen implementation inside that region.
Why We Use Medians
Microcap returns and ranges have extremely heavy tails.
A handful of 300%, 1,000% or larger observations can dominate an arithmetic mean.
That is undesirable when the practical product question is:
What should a typical selected day look like?
The research therefore emphasizes:
- median ticker-day Day1 range,
- median daily Top10 basket range,
- date-cluster bootstrap intervals,
- and five-session block bootstrap intervals where relevant.
This reduces the influence of a few extraordinary events.
It also forces us to distinguish a rule that occasionally catches a spectacular stock from a rule that consistently identifies volatile situations.
Why We Bootstrap Dates Instead of Individual Ticker-Days
Ticker-days from the same session are not fully independent.
A macro event, speculative cycle, risk-on day or market-wide volatility regime can affect many stocks at once.
Treating every selected ticker-day as an independent observation would therefore make confidence intervals look more precise than they really are.
Where bootstrap intervals were used for rules, we resampled trading dates.
For time-dependence sensitivity, five-session blocks were also used in basket analysis.
This does not solve every dependency problem, but it is more appropriate than pretending each stock-day is statistically isolated.
What Day1 Quality Checks Were Not Allowed to Influence Selection
We also evaluated a stricter post-selection Day1 quality condition:
- at least 8 next-session bars
- and at least $1M Day1 dollar volume
Only 115 of 239 selected daily baskets had all ten candidates satisfy that strict definition.
In HOLDOUT, the count was 33 of 72.
Crucially:
Day1 liquidity was never used as an input to choose Day−1 winners.
Using future liquidity to decide which historical candidate “should have been selected” would be direct hindsight.
The strict Day1 quality result is therefore reported as a sensitivity diagnostic only.
What the Evidence Says We Should Watch
If the objective is next-session volatility potential, the historical evidence supports this ordering of attention:
1. Day−1 Full Range
The strongest single observed gradient.
It tells us whether the stock has already entered an unusually large price-discovery state.
2. After-Hours Dollar Activity
Both absolute and relative AH activity were informative.
It tells us whether substantial interest persisted after the regular session.
3. Median20 RVOL
It measures whether the Day−1 participation was abnormal relative to that ticker’s own recent history.
4. Full Dollar Volume
It prevents a huge percentage move in a barely traded stock from being treated the same as a move backed by meaningful absolute turnover.
5. Historical Market Cap
It defines the structural volatility regime.
Smaller historical market caps had materially higher future range base rates.
6. Close Position and Range-Edge Context
These were more useful as conditional descriptors of the Day−1 state than as dominant standalone signals.
We Are Ranking Situations, Not Indicators
This is the deepest conclusion of the research.
The useful unit is not “RVOL.”
It is not “range.”
It is not “after-hours volume.”
It is the joint state.
Priority 1 is a good example:
- Full Range ≥150%
- Median20 RVOL ≥3×
- Full Dollar Volume ≥$5M
- AH Dollar Share ≥5%
Each variable answers a different question.
Range: how much price discovery occurred?
RVOL: how abnormal was participation relative to the stock’s own history?
Dollar Volume: was the move backed by meaningful absolute turnover?
AH Dollar Share: did participation persist after the regular session?
The combination describes a market situation.
That is much more informative than saying:
“RVOL > 3 is good.”
The empirical statement is:
In this historical dataset, a sub-$500M stock that had already produced ≥150% full-session range, ≥3× median20 volume, ≥$5M full dollar volume and ≥5% after-hours dollar share was followed by an 81.81% median Day1 range in the HOLDOUT sample.
That is the central logic behind the Microcap Engine PM Preparation selection framework.
From Historical Ranking to the Final PM Preparation List
The 239-session study determines which Day−1 states deserve priority. It does not use social-media activity to discover or validate those historical rules.
After the empirically qualified candidate set is built, Microcap Engine applies a separate Grok AI X Attention layer to order the final list by how actively each ticker is being discussed on X from the previous U.S. regular-session close at 16:00 ET through the exact PM Preparation research time.
This is not a raw mention count. More recent discussion receives substantially more weight, and the ranking favors substantive activity across multiple independent trader accounts, active replies and relevant discussion around catalysts, momentum, float/dilution, squeeze risk, offerings, news and trading activity. Automated feeds, bots, repetitive ticker spam and stale discussion are intentionally discounted.
The distinction is important:
Historical Day−1 research answers which stocks have the strongest empirically supported next-session volatility profile. X Attention answers which of those qualified names are receiving the most current trader attention now.
The final publication also carries high-quality float and dilution-risk context. Float values receive an explicit manual verification pass because stale or structurally incorrect float data can materially distort how a microcap setup is interpreted.
Before the PM Preparation list is published each morning, I personally review the final list and its key market-structure fields, including the float and dilution-risk context, as a final quality-control step. That human QA is a publication safeguard; it does not retroactively change the historical Day−1 → Day1 research results.
What This Research Does Not Prove
The evidence is substantial, but it has boundaries.
1. Day1 range is volatility potential, not trading profit.
A 70% range does not say whether the best trade was long or short, whether the move occurred before an entry, or whether a fill was realistic.
2. Exact thresholds are not unique optima.
Nearby values often performed similarly, which is why we treat the strongest findings as parameter regions rather than isolated magic numbers.
3. Historical market cap is vendor date-stamped, not independently certified SEC-known-at.
4. Extreme bar highs/lows were not independently re-audited against raw SIP prints in this specific parameter study.
This article therefore presents an empirically grounded selection model, not a guarantee of future volatility. The live PM Preparation workflow is monitored separately as an additional layer of evidence after the historical research is frozen.
FAQ
Is the Microcap Engine PM Preparation watchlist manually selected?
The empirical ranking is data-driven. The priority states and broader ranking were derived from historical Day−1 features and evaluated against Day1 full-session volatility. Before publication, Jozef personally reviews the final list each morning as a quality-control step, including manual verification of float and a review of dilution-risk context. That review does not replace or retrospectively alter the historical ranking logic.
How does X Attention affect the final list?
X Attention is a separate real-time ordering layer applied after the historically qualified candidate set is built. Grok AI evaluates discussion on X from the previous U.S. RTH close at 16:00 ET through the PM Preparation research time, with more weight on newer and more substantive discussion across independent trader accounts. It is used to rank current attention, not to create the historical Day−1 rules.
What outcome was the model optimized for?
Median Day1 04:00–20:00 ET high-low percentage range. It is direction-neutral and is not a long-return or short-return target.
What was the strongest single historical variable?
Day−1 full-session range showed the strongest single monotonic gradient in the reported HOLDOUT. Median Day1 range rose from 13.11% at a ≥10% Day−1 range threshold to 51.84% at ≥150%.
What are the exact strongest parameter combinations?
Priority 1 is Full Range ≥150%, Median20 RVOL ≥3×, Full Dollar Volume ≥$5M and AH Dollar Share ≥5%. Priority 2 is Full Range ≥100%, Median20 RVOL ≥20×, AH Dollar Share ≥30% and Close Position ≥20%, after excluding Priority 1. Priority 3 is Full Range 60–<100%, AH Dollar Volume ≥$1M and Close Position ≥70%, after excluding the first two priorities.
What happens when there are not enough Priority 1–3 stocks?
Priority 4 uses AH Dollar Volume ≥$300k as a coverage reserve. Priority 5 uses Full Range ≥20% only as emergency capacity. Within a priority, candidates are ranked by the explicit Day−1 percentile score disclosed in this article.
Is a stock selected twice if it matches several rules?
No. The system is hierarchical. The first matching priority wins and each ticker can be selected at most once.
Is the broader ranking arbitrary?
No. It is a deterministic weighted percentile score: 33% range, 20% dollar volume, 15% median RVOL, 10% AH relative activity, 10% range-edge context, 5% AH dollar volume, 5% AH range ratio and 2% AH dollar share.
Does the model predict direction?
No. The entire research target is next-session volatility, not direction.
Are the thresholds guaranteed to work in the future?
No historical relationship is a guarantee. The evidence is strongest for the broader parameter regions and ranking hierarchy rather than for one uniquely optimal cutoff, which is why Microcap Engine keeps the rules fixed and monitors their live behavior over time.
Methodology and Scope Note
This article discloses the core logic of Microcap Engine’s final 239-session RAW V2 PM Preparation parameter research completed on October 11, 2026.
The historical source contained 171,701 ticker-days across 239 signal sessions. After issuer-identity and signal-day bar-quality controls, 170,539 ticker-days entered the analytical dataset.
The primary outcome was Day1 04:00–20:00 ET high-low percentage range.
The research was direction-neutral.
Signal-day intraday features were derived from raw/unadjusted 30-minute historical bars. Median20 RVOL used Day−1 full-session volume divided by the median of the preceding 20 completed sessions, with prior volume normalized as-of for splits. Historical market cap used FMP’s date-specific historical market-cap series.
The main rule search required supported candidates to satisfy minimum sample size, date coverage, issuer coverage and outcome-completeness gates in both FIT and VALID. Candidate rules were shrinkage-adjusted toward split baselines, penalized for FIT/VALID disagreement, and then tested inside a daily 10-name basket. Incremental tiers had to improve the VALID daily-basket median by at least 0.50 percentage points without materially degrading FIT.
The broader Day−1 ranking used fixed within-day percentile weights disclosed above. The same ticker could enter the list only once and ordering was deterministic.
The live publication workflow then adds a separate current-attention and data-QA layer: Grok AI X Attention ranks qualified names using X discussion from the previous U.S. RTH close at 16:00 ET through the research time, while the final list receives a personal morning QA pass before publication. Float is manually verified and dilution-risk context is reviewed separately from the historical volatility model.
Confidence intervals for rule outcomes resampled trading dates rather than treating ticker-days as fully independent. Block-bootstrap sensitivity was used for selected daily-basket comparisons.
The final 72-session HOLDOUT is a later chronological evaluation segment within an iterative research program, so it is treated as retrospective historical validation rather than described as prospective evidence.
The research therefore supports the proposition that Microcap Engine’s PM Preparation selection logic is empirically grounded in historical Day−1 → Day1 relationships. It does not claim guaranteed future volatility, directional profitability or a universally optimal set of thresholds.