
Market Data
Reverse Splits Break More Than Price: Market Cap, Float Rotation and Backtest Adjustments
What MULN and OLB SEC Filings Reveal About Split-Aware Microcap Data
Summarize this research with AI
Open the article in your preferred assistant with a ready-to-use summary prompt.
The prompt is also copied to your clipboard as a fallback if the provider does not prefill it automatically.
Key findings
- MULN's June 2, 2025 1-for-100 split changed reported common shares outstanding from approximately 79.9 million to approximately 798,650; new CUSIP 62526P802, but no automatic 100-fold creation of enterprise value.
- OLB's 2024 1-for-10 split had different legal and market-trading dates. Its initial 8-K gave 1,810,346 post-split shares, while its subsequent 10-Q described 1,810,200 issued shares after a 146-share fractional adjustment and 1,797,583 outstanding shares after 12,617 treasury shares.
- OLB retained 50 million authorized common shares. The authorized-to-outstanding ratio therefore rose sharply on a split-normalized capital structure, although authorization alone is not evidence of issuance or sale.
- If price, shares outstanding, share volume and free float use different split bases, market cap, RVOL, float rotation, gap percentage and moving indicators can become mathematically wrong.
- Microcap Engine's documented backtest methodology preserves historical raw/as-traded bars, explicit effective-date split events and separate point-in-time-adjusted reference views; existing positions require quantity and cost-basis transformations.
Core idea. A reverse split does not merely turn ten shares into one. It changes the unit in which prices, quantities, share counts and derivative contracts are expressed. The most dangerous error is combining numbers from opposite sides of the split as if they described the same share unit. Our SEC review of MULN and OLB shows why this matters for market capitalization, float rotation, previous close, warrants and point-in-time backtesting.
A stock goes through a reverse split overnight. Its quoted price rises mechanically, its reported share count falls, and its trading symbol may remain unchanged. A chart service, screener and fundamentals vendor can each be numerically correct in isolation—and still form a misleading combined picture.
For a microcap trader, this is not a theoretical data-engineering problem. A wrong split basis can make market capitalization appear to multiply, make a normal volume session look like extraordinary float rotation, generate a false overnight gap, change a technical indicator and lead a historical strategy to select a stock that should not qualify.
We reviewed primary SEC documents for two concrete cases: Mullen Automotive (MULN), 1-for-100 in June 2025, and The OLB Group (OLB), 1-for-10 in 2024. We also connect those filings to the split-aware data and execution rules documented in Microcap Engine's backtesting methodology.
The evidence supports an important distinction: a split is an economic-unit conversion subject to legal and operational exceptions, not permission to divide every company-related number by the split ratio.
What Does a Reverse Split Actually Change?
For a reverse split of 1 new share for every R old shares, the baseline transformations are:
| Quantity | Equivalent post-split basis | Critical qualification |
|---|---|---|
| Historical pre-split price | Pre-split price × R | Display/reference normalization, not the price a trader actually paid then |
| Historical pre-split share volume | Pre-split volume ÷ R | An equivalent-share view; actual historical prints stay unchanged |
| Holder share quantity | Old quantity ÷ R | Subject to rounding and fractional-share settlement |
| Per-share cost basis | Old per-share basis × R | Tax lots and cash in lieu can require additional reconciliation |
| Common shares outstanding | Roughly old outstanding ÷ R | Exact count depends on fractional handling and subsequent transactions |
| Free float | Roughly old eligible float ÷ R | Only if the same restricted/unrestricted cohort is tracked and restrictions do not change |
| Warrant or option underlying shares | Often divided by R | Only under the instrument's contract terms |
| Warrant exercise/conversion price | Often multiplied by R | Contract-specific anti-dilution or adjustment provisions apply |
| Authorized shares | Not necessarily reduced | Must read the actual charter amendment |
| Total company value | Not mechanically created by the split | Price × corresponding shares must be matched to the same basis |
An ideal 1-for-100 transformation makes an illustrative $0.20 share become a $20 share, while 100 shares become one. That does not mean a company gained 9,900% in economic value overnight. This is an arithmetic example, not an observed MULN price.
The complications appear when legal records, market prices and historical datasets update on different schedules.
Case Study 1: What Did MULN's June 2025 1-for-100 Filing Actually Say?
Mullen Automotive's Form 8-K reports that its 1-for-100 reverse split became effective June 2, 2025 at 12:01 a.m. ET. Nasdaq trading began on the split-adjusted basis at the market open the same day.
The filing gave these approximate common-share counts:
| MULN June 2, 2025 | Filed value |
|---|---|
| Split ratio | 1-for-100 |
| Common outstanding before | Approximately 79.9 million |
| Common outstanding after | Approximately 798,650 |
| New CUSIP | 62526P802 |
| Authorized common shares | Not changed by this amendment |
| Par value and common voting rights | Not changed |
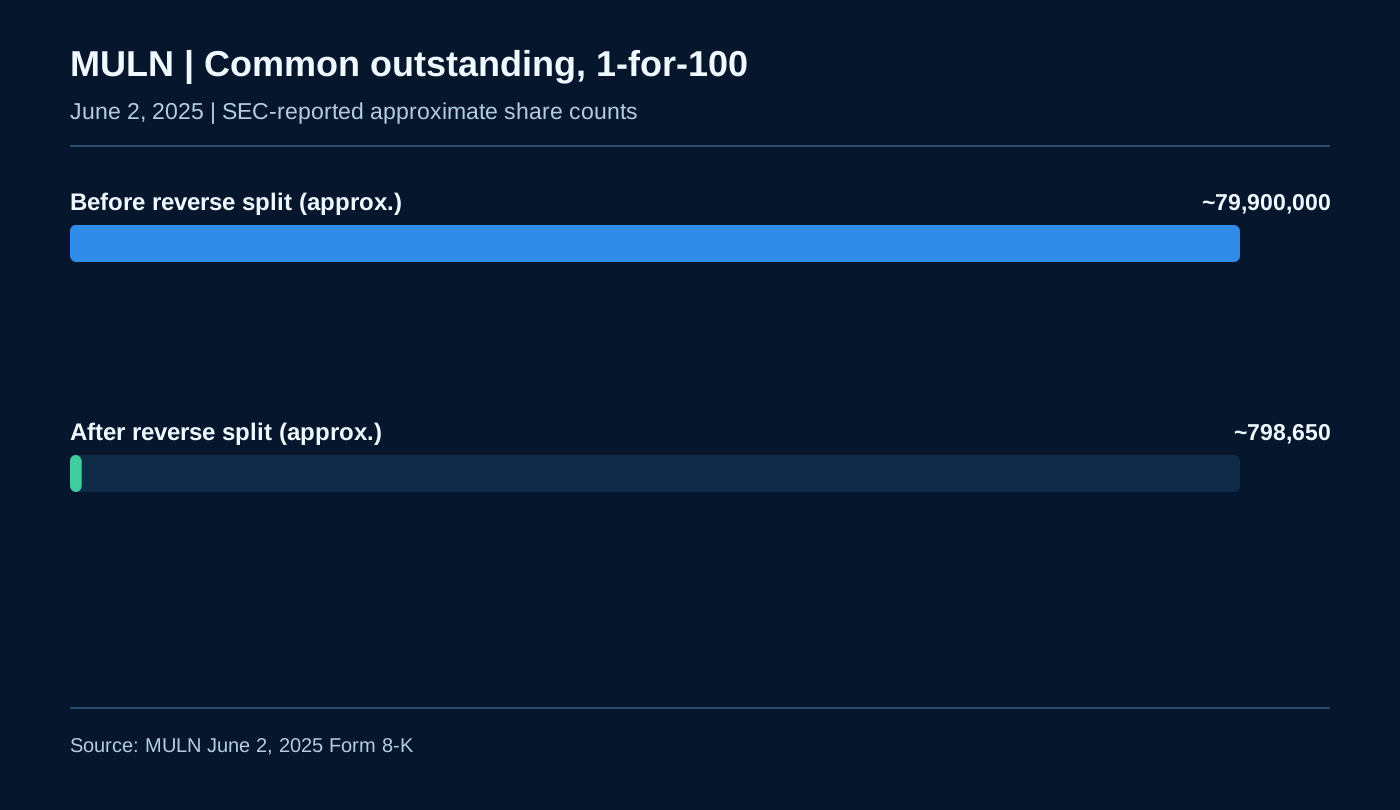
The 8-K also specifies an unusual but important holder-level detail: fractional shares were rounded up to the next whole post-split share after a holder's common shares were aggregated. This is why a generic divide-by-100 calculation is not an authoritative reconstruction of the exact final share ledger.
The newly issued CUSIP identifies a changed security representation even while the trading symbol remained MULN. A backtest should link pre- and post-event records by a verified security identity and corporate-action event—not by assuming that the text of the ticker fully describes all security history.
See the MULN June 2, 2025 Form 8-K.
Why Did MULN's Warrant, Note and Preferred Terms Matter?
The same filing says that split-adjustable instruments—including notes, warrants, preferred shares, options and commitments to issue common securities—have to be treated according to their own agreements.
For affected instruments, the company described corresponding adjustments to underlying common-share quantities and applicable exercise or conversion prices. In a conventional 1-for-100 adjustment, 100 potential common shares may become one potential common share, while a $0.10 exercise price may become $10. Those numbers are illustrative contract math, not a measured quantity or strike for any particular MULN warrant.
The purpose is to keep the aggregate economic price of the relevant entitlement approximately equivalent, subject to contractual terms.
There was also an explicit exception: under the company's 2022 Equity Incentive Plan, as amended, shares reserved and available for future issuance were not subject to split adjustment, while outstanding options were adjusted as applicable.
This is material for supply analysis. A naive parser that divides all reserved, authorized or contingent common shares by 100 would overwrite a real contractual exception. A second parser that leaves all outstanding warrant terms unchanged could be wrong in the opposite direction.
The 8-K additionally described proportional reductions to undistributed shares covered by certain effective registration statements under Rule 416(b). Registration coverage, outstanding common stock, shares reserved in an incentive plan and warrants exercisable into common stock are four distinct ledgers; none automatically becomes freely tradable float.
Seven Reverse Splits: Why Can MULN History Be Especially Hard to Reconstruct?
A later MULN proxy listed seven reverse splits from May 2023 through June 2025:
| Effective date | Ratio reported |
|---|---|
| May 4, 2023 | 1-for-25 |
| August 11, 2023 | 1-for-9 |
| December 21, 2023 | 1-for-100 |
| September 17, 2024 | 1-for-100 |
| February 18, 2025 | 1-for-60 |
| April 11, 2025 | 1-for-100 |
| June 2, 2025 | 1-for-100 |
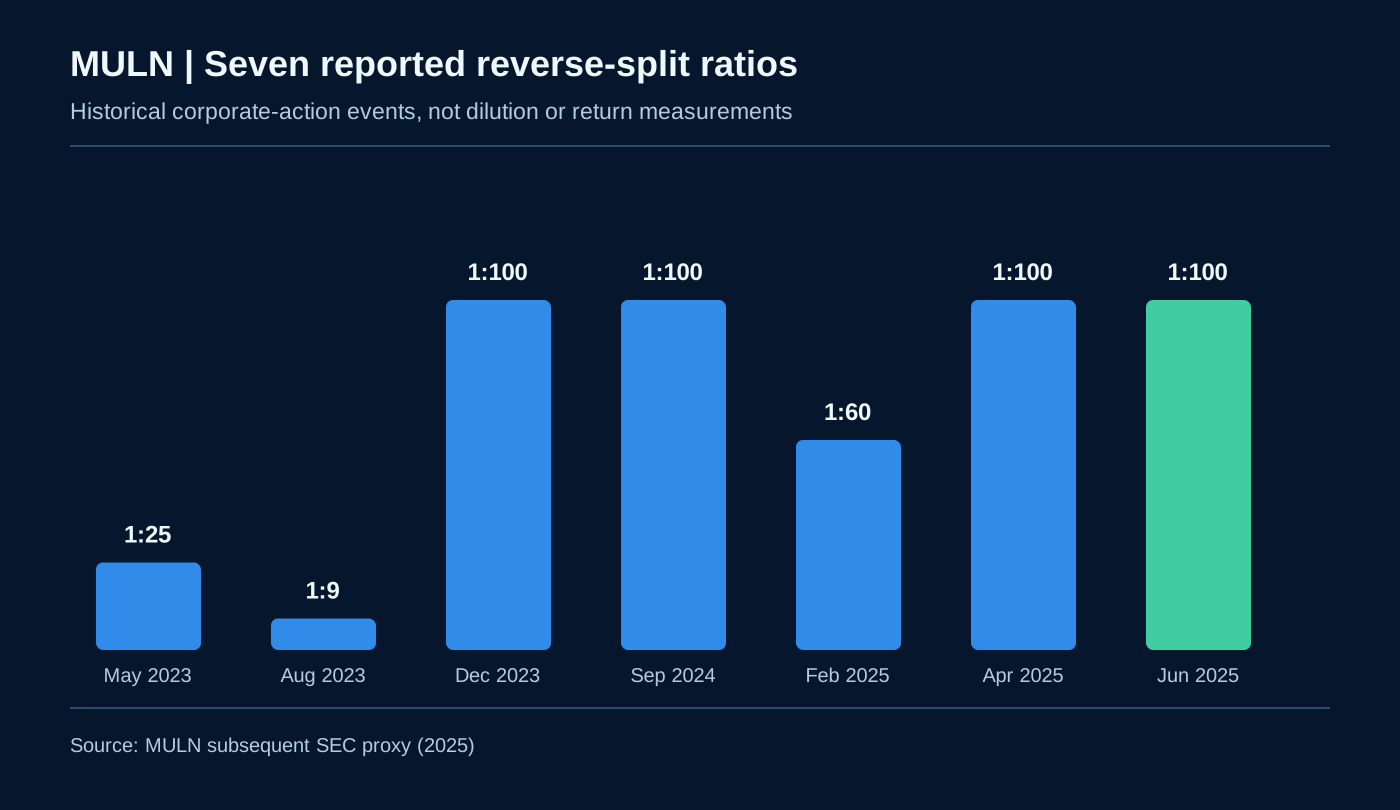
Multiple corporate actions make the as-of date crucial. The factor necessary to display a 2023 price in a 2025 reference basis may contain several split events. The factor that was legitimately known to a trader at a particular time in 2023 cannot include corporate actions announced years later.
It would also be incorrect to multiply the split factors and infer the company's actual economic loss, change in valuation or historical dilution from the mathematical product. Issuances, financings, conversions, changes in capital structure and fractions occurred between those events.
The source is MULN's subsequent SEC proxy. The event chronology can support a correct historical adjustment table; it does not establish a continuous fully reconciled float history on its own.
Case Study 2: How Did OLB's 1-for-10 Split Differ?
OLB provides an independently useful contrast.
Its May 2, 2024 Form 8-K says the company's Delaware charter amendment became effective April 26, 2024, while common stock was to begin split-adjusted Nasdaq trading May 6, 2024. Nasdaq separately published the May 6 split-trading date and new CUSIP 67086U406.
These dates describe different legal and market events. An execution engine should not simply attach every price adjustment to the SEC filing timestamp or infer that the first adjusted market bar appeared on April 26.
The initial 8-K gave:
| OLB split event | Filed value |
|---|---|
| Reverse split | 1-for-10 |
| Pre-split common | 18,103,462 |
| Initially reported post-split common | 1,810,346 |
| Authorized common stock | 50,000,000, unchanged |
| Treatment of fractional interests | Rounded down; cash in lieu |
| Split-adjusted trading date | May 6, 2024 |
A later OLB Form 10-Q sharpened the reconciliation. It said there were 1,810,200 issued common shares after an additional 146-share adjustment associated with not issuing fractional shares. More importantly, its June 30, 2024 balance sheet separately identified 12,617 treasury shares, leaving 1,797,583 common shares outstanding.
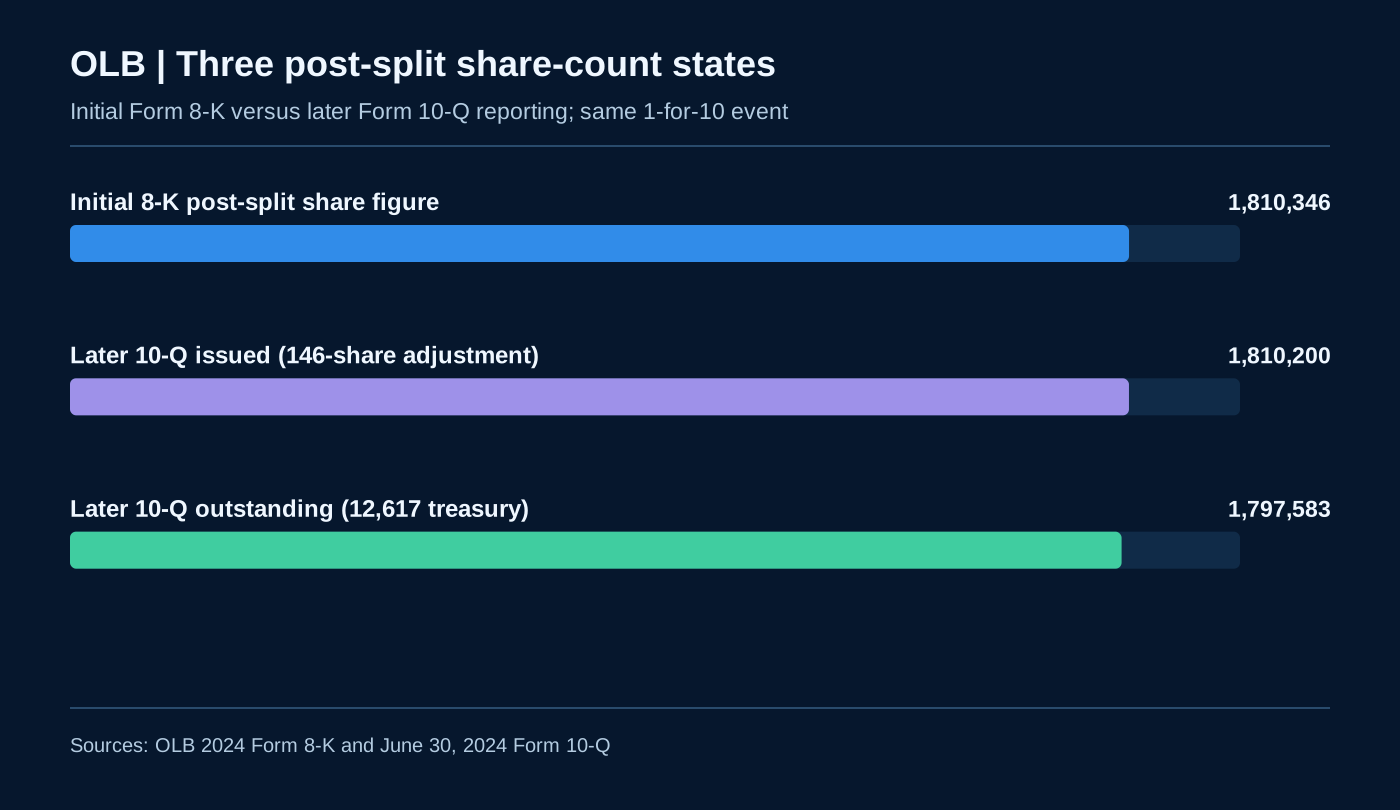
That means there are three different post-split values with three different definitions and/or disclosure stages:
- 1,810,346: initial split-event share count in the May 2 Form 8-K.
- 1,810,200: subsequent Form 10-Q issued common shares, accounting for the 146-share fractional adjustment.
- 1,797,583: Form 10-Q outstanding common shares after the separately stated 12,617 treasury shares.
A market-data model that calls all three “float” would lose exactly the security-structure information that a microcap trader needs.
Sources: OLB May 2, 2024 8-K, OLB June 30, 2024 10-Q, and Nasdaq OLB corporate-action alert.
What Happened to OLB's Authorized Share Capacity?
OLB's authorized common-share count remained 50,000,000.
At the pre-split count of 18,103,462, authorized shares divided by that reported share count was approximately 2.76×. Relative to the later reported 1,797,583 outstanding count, it was about 27.82×.
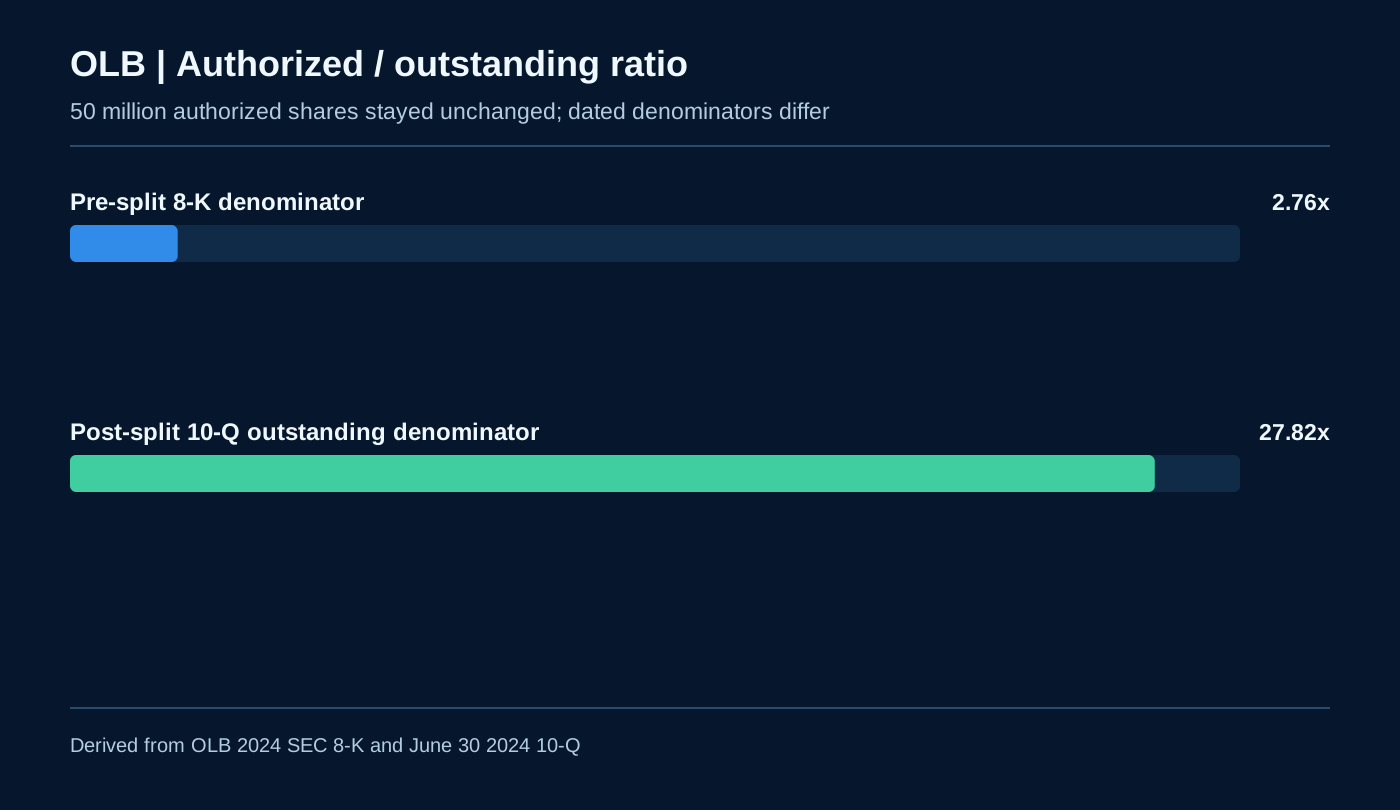
This does not prove a future offering, an ability to sell all remaining authorized shares, or an increase in immediately tradable float. Issuance can depend on exchange limits, governance approvals, convertible terms, registration, reserves and other constraints.
But the authorized-to-outstanding contrast is real and important: after a reverse split, legal authorization may remain unchanged even when outstanding common shares are sharply reduced.
That is why “the share count dropped by 90%” is not a complete dilution-risk analysis.
What Happens to Historical EPS and Weighted-Average Share Data?
OLB's subsequent registration materials explicitly presented its 2023 historical weighted-average shares and loss per share on pre- and post-split bases.
| OLB year ended December 31, 2023 | Pre-split presentation | Post-split presentation |
|---|---|---|
| Weighted-average shares outstanding | 15,203,708 | 1,520,371 |
| Net loss per common share | −$1.53 | −$15.33 |
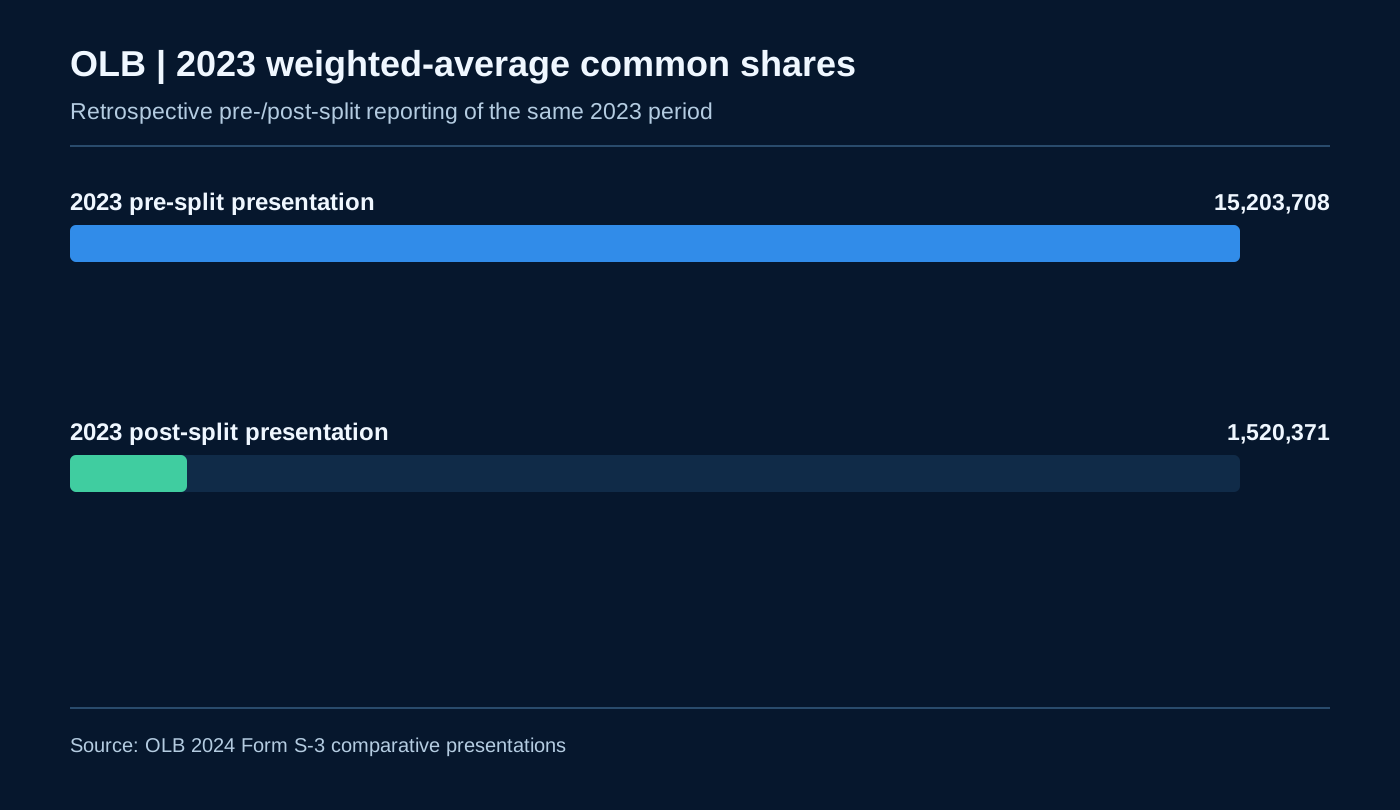
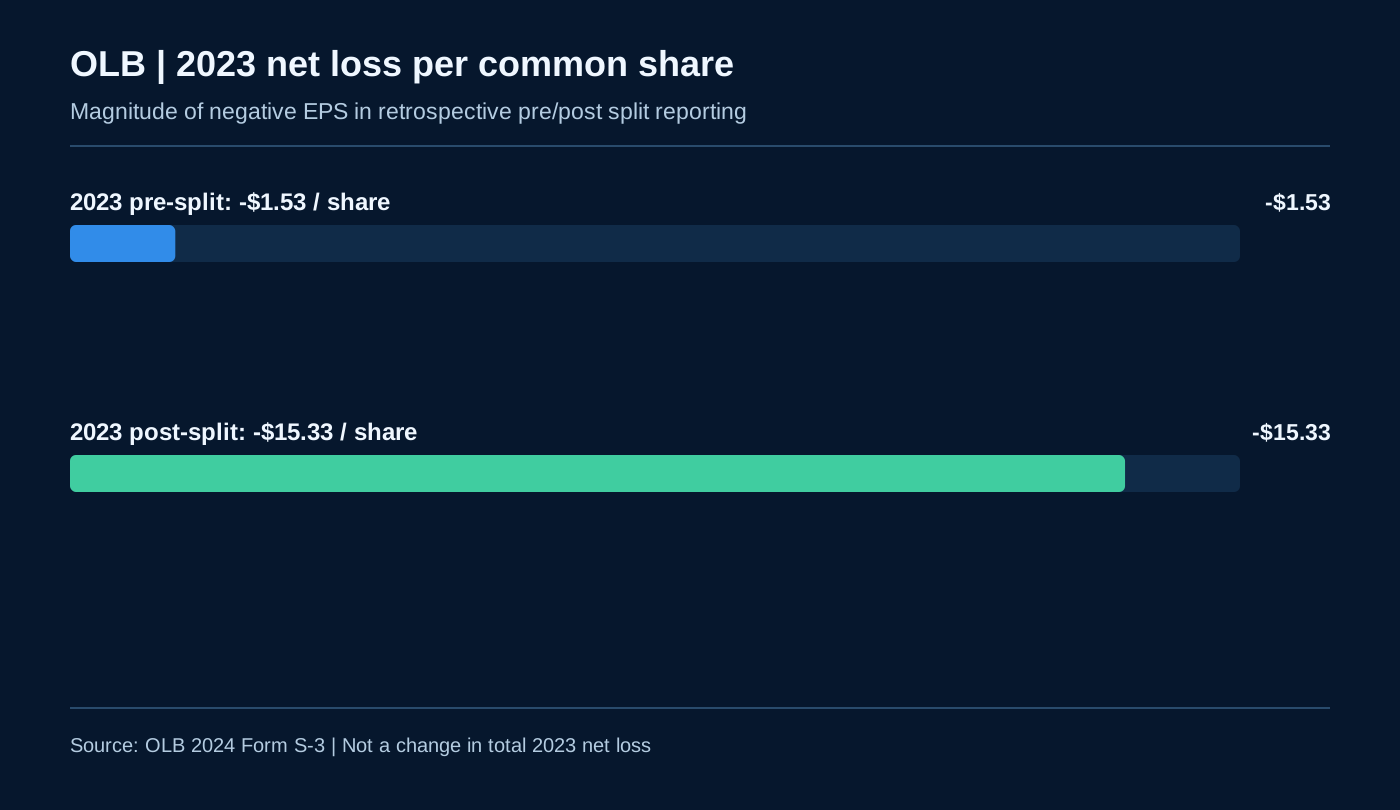
This is a particularly subtle point-in-time error. A 2024 filing can restate 2023 per-share information on a new 2024 share basis. That does not mean the 2024 presentation was available to a strategy running in 2023.
Research systems must distinguish two legitimate questions:
- What was originally observable at the 2023 decision time?
- How should 2023 amounts be expressed for a comparison on the post-2024 share basis?
Those are separate queries, not one timeless “historical EPS” value.
The restatement source is OLB's 2024 S-3; the 10-Q also states that share information was retroactively restated for split presentation.
Why Doesn't a Reverse Split Mechanically Multiply Market Cap?
A compatible pair of prices and shares keeps the arithmetic consistent.
Market cap = market price per share × common shares outstanding on the same unit/date basis.
For an ideal 1-for-100 split:
| Pure split arithmetic | Before | Equivalent after |
|---|---|---|
| Price (illustrative only) | $0.25 | $25 |
| Common shares (illustrative only) | 100,000,000 | 1,000,000 |
| Implied market cap | $25,000,000 | $25,000,000 |
The error is mixing $25 post-split price × 100 million pre-split shares, which produces a fictitious $2.5 billion market cap.
The same principle applies when screening a sub-$500M universe. Combining a post-split market price with pre-split shares outstanding can incorrectly exclude a microcap; combining a raw historical price with a future-restated share count can incorrectly include one.
In reality, trading prices can change, financing can occur, and fractional settlement can slightly alter shares outstanding. The point is narrower: the split itself does not mechanically create market value.
Does Float Automatically Shrink by the Split Ratio?
Only an equivalent-unit transformation is automatic in the simple theoretical case.
Suppose a specific verified cohort of 10 million freely tradable pre-split shares becomes one million post-split shares in a 1-for-10 split. Both counts describe the same economically equivalent cohort, adjusted for legal restrictions and fractional settlement.
But if a provider knows only outstanding shares—not restricted holders, beneficial ownership, lock-up status, unregistered issuance, lendable inventory or eligible common-share class—it cannot manufacture a verified float simply by dividing the outstanding count.
This matters especially for microcaps where a stock can have:
- shares newly issued to a private investor;
- shares covered by an effective or pending resale registration;
- unexercised warrants or convertible notes;
- affiliate/control stock subject to sale limitations;
- a large treasury-stock position;
- changing beneficial owners and lock-ups.
The correct system records what the underlying share number means, which security class it covers and when that state became known.
For a deeper explanation of these separate share states, see our Shares Outstanding Is Not Float research.
How Can a Split Create Fake Float Rotation?
Float rotation is commonly calculated as:
Float rotation = traded share volume ÷ freely tradable float shares.
The numerator and denominator must represent the same share unit and time basis.
For a 1-for-100 conversion, an illustrative pre-split day with 10 million shares traded and a verified two-million-share float has 5.0× rotation. Expressed consistently on a post-split-equivalent basis, 100,000 shares traded divided by 20,000 float shares is still 5.0×.
But a system using 10 million pre-split shares traded and 20,000 post-split float shares would display 500×—a 100-fold artifact. These are intentionally illustrative figures, not observed MULN volume/float data.
| Basis used | Volume | Float | Rotation |
|---|---|---|---|
| Consistent pre-split units | 10,000,000 | 2,000,000 | 5× |
| Consistent post-split-equivalent units | 100,000 | 20,000 | 5× |
| Mismatched historical volume + future-adjusted float | 10,000,000 | 20,000 | 500× (false) |
No actual MULN or OLB free-float measurement was inferred from the reviewed split filings. The example demonstrates the failure mode, not a measured historical squeeze.
What About RVOL, Dollar Volume and Volume-Based Scanners?
Three similar-looking metrics need different treatment.
Share volume changes units after a split. If you are comparing share volume across the boundary on an equivalent-share basis, pre-split volume must be normalized consistently. Otherwise a rolling baseline may contain one hundred times too many legacy shares.
Dollar volume is price × shares. In an ideal matched-basis adjustment, multiplying historical price by 100 and dividing its share volume by 100 leaves dollar volume approximately unchanged. Real trade prices, vendor rounding and execution details still matter.
RVOL is current volume divided by a historical reference window. If one part of the reference is on pre-split raw units and the current session is on post-split units, RVOL can collapse or explode for purely mechanical reasons.
A split-aware scanner must know both the aggregation session basis and the reference lookback basis, rather than applying one adjustment to a chart while leaving the RVOL denominator untouched.
The same issue affects volume spikes, float turnover, share-volume moving averages, turnover z-scores and the thresholds used in a premarket watchlist.
How Do Reverse Splits Distort Previous Close, Gaps and Technical Indicators?
Consider an illustrative 1-for-100 split with a $0.30 pre-split prior close and a $30 post-split market open.
A naive scanner comparing $30 against $0.30 prints a false +9,900% gap.
A split-normalized prior close is $30, producing 0% mechanical gap before any genuine market price change.
The relevant definitions are:
Split-comparable gap % = (new-session open / prior close expressed on the new share basis − 1) × 100.
The same scale discontinuity can corrupt technical signals. An EMA, VWAP reference, moving average, ATR or stop threshold should not interpret a split factor as a genuine intraday price jump. Stateful indicators may require rescaling their stored state across the corporate-action boundary rather than merely displaying previously stored raw history at a different scale.
But adjustment is purpose-specific. A trader's historical executed fill was the raw price at that timestamp, and should not be rewritten as though the higher post-split equivalent price actually traded then.
What Happens to a Position's Quantity and Cost Basis?
A split that occurs while a position is open requires a portfolio-state transformation.
Consider an illustrative long position in a stock with a 1-for-100 split:
| Position state | Before | After, assuming no fractional settlement |
|---|---|---|
| Quantity held | 10,000 shares | 100 shares |
| Per-share acquisition cost | $0.40 | $40 |
| Total acquisition cost | $4,000 | $4,000 |
| Stop originally at $0.32 | $0.32 | $32 equivalent |
| Take profit originally at $0.60 | $0.60 | $60 equivalent |
The position's economic exposure is not multiplied by 100. Its units change.
A robust engine also accounts for broker-specific fractional handling, adjusted limit/stop order rules, residual cash-in-lieu, short positions and contractual derivative behavior. Corporate actions can change order quantities and stop/target reference units; they should not be booked as 9,900% trading profit.
The tax basis of actual lots can involve additional rules for fractional cash payments. This example explains trading-system normalization; it is not individual tax advice.
What Must a Point-in-Time Backtest Do Differently?
Microcap Engine's documented backtest methodology deliberately separates as-traded history from comparable adjusted views.
The main commitments are:
- Preserve canonical raw intraday OHLCV and trade observations. The executed transaction stays at the actual historical price/size. Do not overwrite raw records with today's cumulative adjusted chart values.
- Store explicit split events with security identity, ratio, effective trading boundary, source and timestamps for when the event was known. Avoid equating ticker spelling with security identity.
- Use adjustment factors only for splits eligible at the relevant as-of time. A strategy in 2023 cannot consult a 2025 split to create a signal.
- Normalize cross-day reference features explicitly. Previous close, moving averages, ATR, RVOL, historical float and other state need a common basis when crossing a split.
- Reconcile positions and orders at the boundary. Quantity, cost basis, stop/target references and derivative rights are transformed according to the event and governing terms.
- Keep scanner and backtest semantics aligned. The historical signal should use the same data availability, price basis and security-event state that the live decision engine would have used.
This is a description of the documented design and correctness rules, not a claim that every combination has already been independently production-certified against real broker fills.
A good architecture can provide two legitimate views:
| View | Role |
|---|---|
| Raw/as-traded | Historical candle, transaction prices, volume, fills and execution audit |
| Point-in-time comparable | Cross-split technical references and share-unit comparisons using splits known at the evaluation time |
The adjusted display is derived. It must not silently become the execution source of truth.
For the related problems of chart construction and data eligibility, see From Raw SIP Trades to Clean, Chart-Ready OHLCV Candles.
Why Can a Vendor's Historical Series Disagree with a 2023 Strategy Replay?
A modern vendor may serve fully split-adjusted historical aggregates, while the original tape consists of raw prices and volumes.
Massive explicitly documents that its aggregate API can return split-adjusted or unadjusted series, whereas its raw flat-file trade data is unadjusted. It also notes that split-adjusted volume can be fractional because a historical volume count has been converted to equivalent share units.
Those are legitimate datasets for different purposes.
Problems occur when historical backtesting combines:
- a price series already adjusted through splits not yet known at the signal time;
- a raw share-volume series on a different unit basis;
- shares outstanding retroactively restated in a later filing;
- a current free-float estimate applied to an old ticker date;
- and a technical-indicator state calculated across an unnormalized split.
The solution is not to declare one series universally correct. It is to define the time and unit basis for each computation.
Which Reverse-Split Checks Should a Microcap Trader Run?
The two SEC examples suggest a concrete verification checklist:
- Confirm the actual effective and split-trading dates, not just the date a filing was signed or published.
- Find the pre- and post-split basic common share counts and check whether the numbers are approximate.
- Distinguish issued, outstanding, treasury and freely tradable float before calculating market cap or float rotation.
- Read whether authorized shares remain unchanged and whether any equity plan reserves have an explicit exception.
- Recheck the warrants, notes, preferred stock and options adjustment provisions rather than assuming every security scales identically.
- Identify fractional share policy: cash in lieu, round-up or another stated mechanism.
- Ensure previous close, moving references, share volume, RVOL and historical float use a consistent basis.
- For a backtest, require a reproducible as-of disclosure/effective-event trail rather than a retroactively adjusted chart as the sole record.
These are not optional technical niceties if a research product claims trustworthy microcap screening or historical strategy results.
What the MULN and OLB Cases Do — and Do Not — Prove
The verified filing evidence establishes the announced split ratios, documented dates and reported share-state changes. It also establishes real company-specific exceptions: MULN's equity-plan reserve treatment and round-up policy; OLB's cash-in-lieu treatment, treasury shares and revised post-event reporting.
The filings do not supply an independently verified live free float, actual 1-minute traded volume around every event, stock-price path, short availability or a completed profitable backtest of these cases. We therefore do not invent measured float rotation, RVOL or P&L results for either issuer.
The illustrative formulas in this article demonstrate what must remain mathematically consistent. The SEC case studies demonstrate why the real legal/share-count inputs need more than a generic divide-by-R rule.
FAQ
Does a 1-for-100 reverse split increase a company's market cap?
Not by itself. In an ideal split, share price is expressed in 100-times-larger units while the economically equivalent share count is divided by 100. Market cap should be calculated using the same-date, same-basis price and outstanding share count; subsequent market price changes and financing events are separate.
Does a reverse split automatically change the free float by the exact ratio?
It changes the equivalent share unit, but a true float figure also depends on holder eligibility, restrictions, security class and fractional treatment. A provider cannot calculate reliable float merely by dividing an unsupported shares-outstanding estimate.
How should volume and float rotation be adjusted after a reverse split?
Compare quantities on the same split basis. For a 1-for-100 conversion, equivalent historical share volume and the corresponding float cohort each divide by 100, leaving the rotation ratio unchanged if both inputs represent the same event state. Mixing old volume with new float creates false rotation.
Are warrants and convertible notes always divided by the same factor?
No. Actual terms control the conversion or exercise adjustment. MULN's 8-K described adjustments for eligible outstanding notes, warrants, preferred stock and options, but also specifically exempted available equity-incentive-plan reserve shares from adjustment.
How should a backtest handle previous close and the opening gap?
Normalize the previous close to the share basis of the new session before calculating a cross-split percentage gap. Preserve the historical raw fills and adjust comparative reference calculations separately; otherwise a mechanical split can masquerade as an enormous market move.
Does an adjusted historical chart show what traders actually saw at the time?
Not necessarily. A vendor's fully adjusted chart may apply later corporate actions to much earlier data. A point-in-time strategy replay must distinguish data available at the historical decision timestamp from today's retrospective presentation.
Methodology and Scope Note
This article is a primary-document case-study analysis, not a statistical multi-issuer outcome test. We reviewed MULN's June 2, 2025 Form 8-K and later proxy, OLB's May 2, 2024 Form 8-K, subsequent June 30, 2024 Form 10-Q, 2024 S-3 restatement and Nasdaq's OLB trading-date notice. Figures reproduce or calculate metrics directly from the identified filings.
For OLB, the initial split-event 8-K, subsequent issued share count and later balance-sheet outstanding count are deliberately labeled by definition and reporting stage, rather than treated as competing estimates of a single float value. OLB's 2023 EPS and weighted-average share figures are restated historical presentation values. MULN's 79.9 million is explicitly approximate. Authorized/outstanding ratios are straightforward arithmetic derived from published counts, not predictions of securities offerings.
Where real transaction price, verified float, daily volume, tax lot basis or execution outcomes are not furnished by the sources, examples are plainly labeled illustrative. The split-aware trading/backtest treatment reflects Microcap Engine's documented raw-data and point-in-time adjustment design, not a completed empirical claim of broker execution accuracy.
All figures and conclusions should be read with their corresponding filing date, economic unit, share class, disclosure timing and legal restrictions.
Selected Public References
- SEC — MULN June 2, 2025 Form 8-K: 1-for-100 reverse split, 79.9M to approximately 798,650, derivative and equity-plan adjustments
- SEC — MULN later proxy: seven historic reverse splits, 2023–2025
- SEC — OLB May 2, 2024 Form 8-K: 1-for-10 reverse split, initial post-split count, 50M authorized shares
- SEC — OLB June 30, 2024 Form 10-Q: 146-share adjustment, 1,810,200 issued, 12,617 treasury and 1,797,583 outstanding
- SEC — OLB 2024 S-3: historical pre-/post-split EPS and weighted-average share presentations
- Nasdaq Trader — OLB corporate-action alert: May 6, 2024 split-adjusted trading and CUSIP 67086U406
- Massive — Unadjusted stock flat files and historical adjusted-series choices
- Massive — Why adjusted historical share volume can be fractional